The Shape of the Season
June 1 to November 30: those dates are not arbitrary. They mark the period when sea-surface temperatures in the Atlantic and Caribbean climb high enough, and upper-level wind shear drops low enough, that a disorganised cluster of thunderstorms can begin to sustain itself and, over days, acquire the rotating structure that becomes a named storm. The National Hurricane Center's historical records show that activity peaks statistically around September 10 — not a cliff-edge but a broad lobe, with August through October carrying the bulk of landfalling risk. June and November are real but thin; the heart of the season is the late-summer window when the Cape Verde wave track — a conveyor belt of disturbances rolling off the West African coast — is at its most productive.
The numbers that define a storm are well established. A tropical depression spins at sustained winds below 39 mph. A tropical storm is named and reaches 39–73 mph. A hurricane begins at 74 mph; Categories 3, 4 and 5 — the "major" threshold — start at 111 mph. These Saffir-Simpson categories measure wind alone. What kills people is more often storm surge, which is a function of a storm's size, its forward speed and the geometry of the coastline it approaches, none of which the category number captures. A Category 2 crossing a wide shallow shelf can push more water than a Category 4 tracking through deep water and moving fast. The category is a starting point, not a summary.
The Atlantic basin varies in activity from year to year along a documented cycle tied partly to the Atlantic Multidecadal Oscillation — a slow, decades-long shift in North Atlantic sea-surface temperatures that influences how many named storms form. ENSO also matters: El Niño years tend to suppress Atlantic activity by increasing wind shear; La Niña years tend to enhance it. Neither relationship is deterministic. A below-average season can still produce the one system that matters.
Maria: What the Record Shows
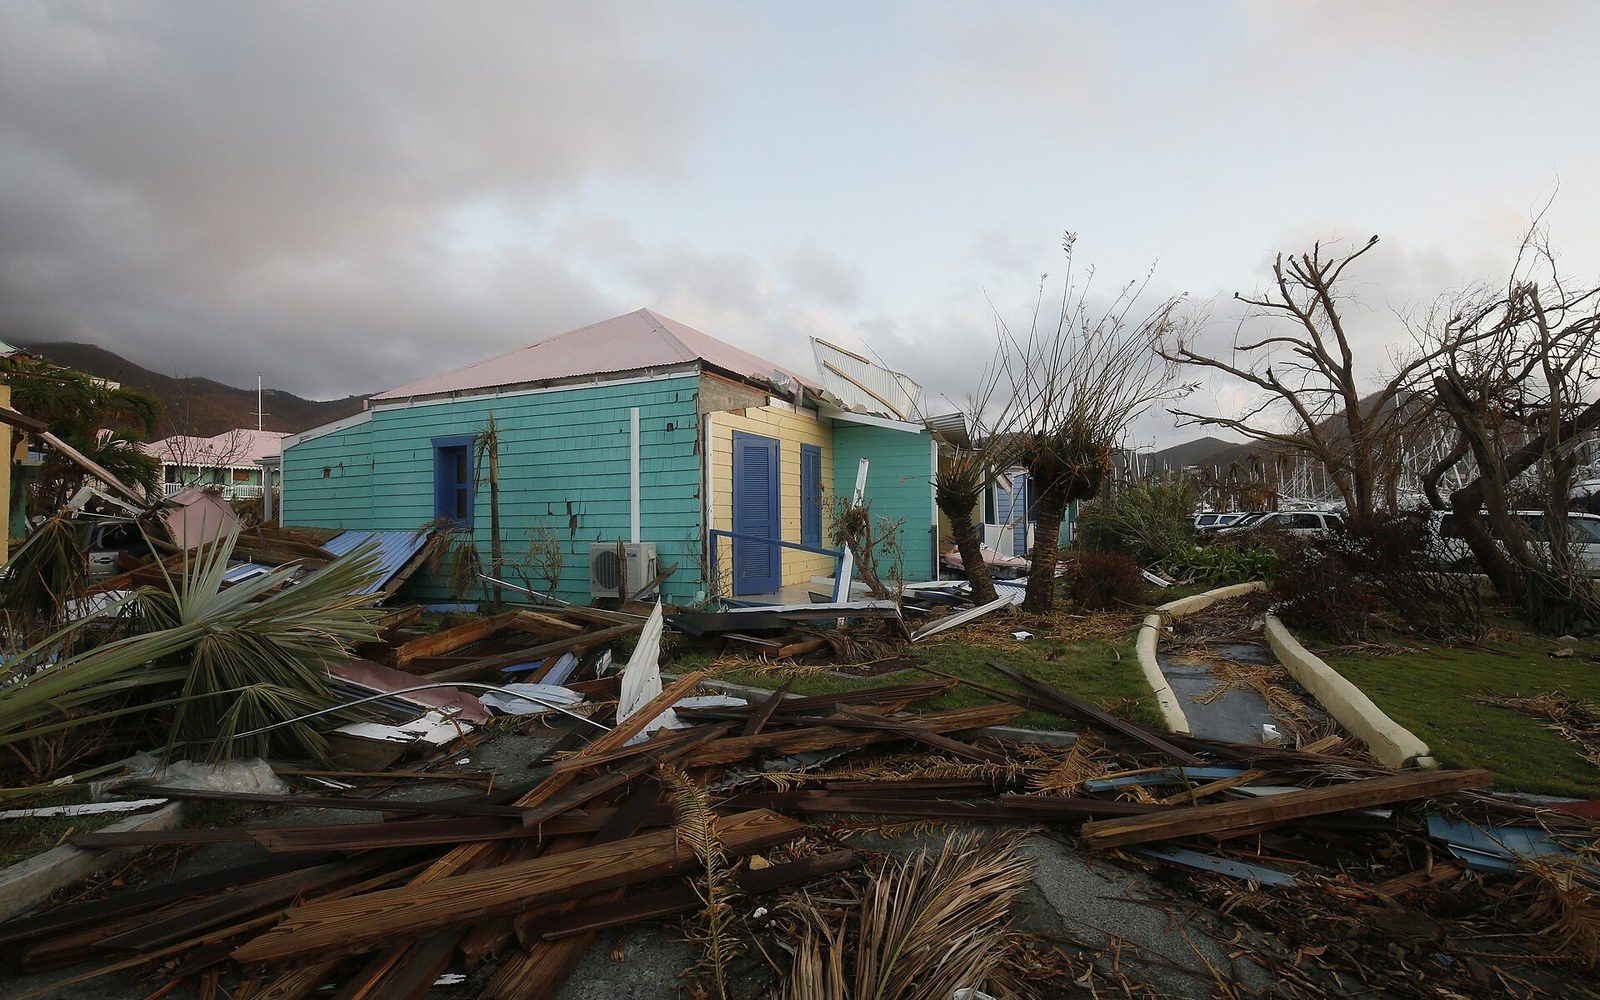
Hurricane Maria in September 2017 is now the reference event for the eastern Caribbean, and the numbers attached to it are precise enough to be worth stating clearly. Maria made landfall in Dominica on September 18, 2017, as a Category 5 storm with maximum sustained winds of 160 mph. An island of roughly 73,000 people lost an estimated 90 percent of its building stock in a matter of hours. The following morning, Dominica's prime minister reported from a damaged shelter that his roof was gone. Maria then intensified further over the Caribbean Sea before striking Puerto Rico on September 20 — the strongest storm to hit the island in nearly ninety years — knocking out electricity to the entire population and a grid that would not be substantially restored for months in the most remote municipalities.
A hurricane begins at 74 mph; Categories 3, 4 and 5 — the "major" threshold — start at 111 mph.
The storm's path across the eastern islands in those forty-eight hours illustrated a structural feature of Caribbean hurricane geography. The Lesser Antilles are arranged in a chain running roughly north to south, and a westward-tracking storm in the right latitude band can thread through them sequentially, with each island taking a different portion of the storm: Guadeloupe and Martinique, just north and south of Dominica respectively, were struck by the same system at different intensities as Maria's eyewall tightened. The geometry of the arc means that catastrophic exposure can be geographically narrow. An island forty miles north or south of the eyewall may record a damaging but survivable storm; the island directly underneath records something that resets the economy.
The 2017 Atlantic season was exceptional overall. Hurricanes Harvey, Irma and Maria made landfall as major hurricanes within a four-week span — a sequence without precedent in the instrumental record. Irma, making landfall in the northern Caribbean islands and Florida, and Maria, striking the eastern and central islands, together caused damage that the World Bank estimated in the tens of billions of dollars across the affected territories.
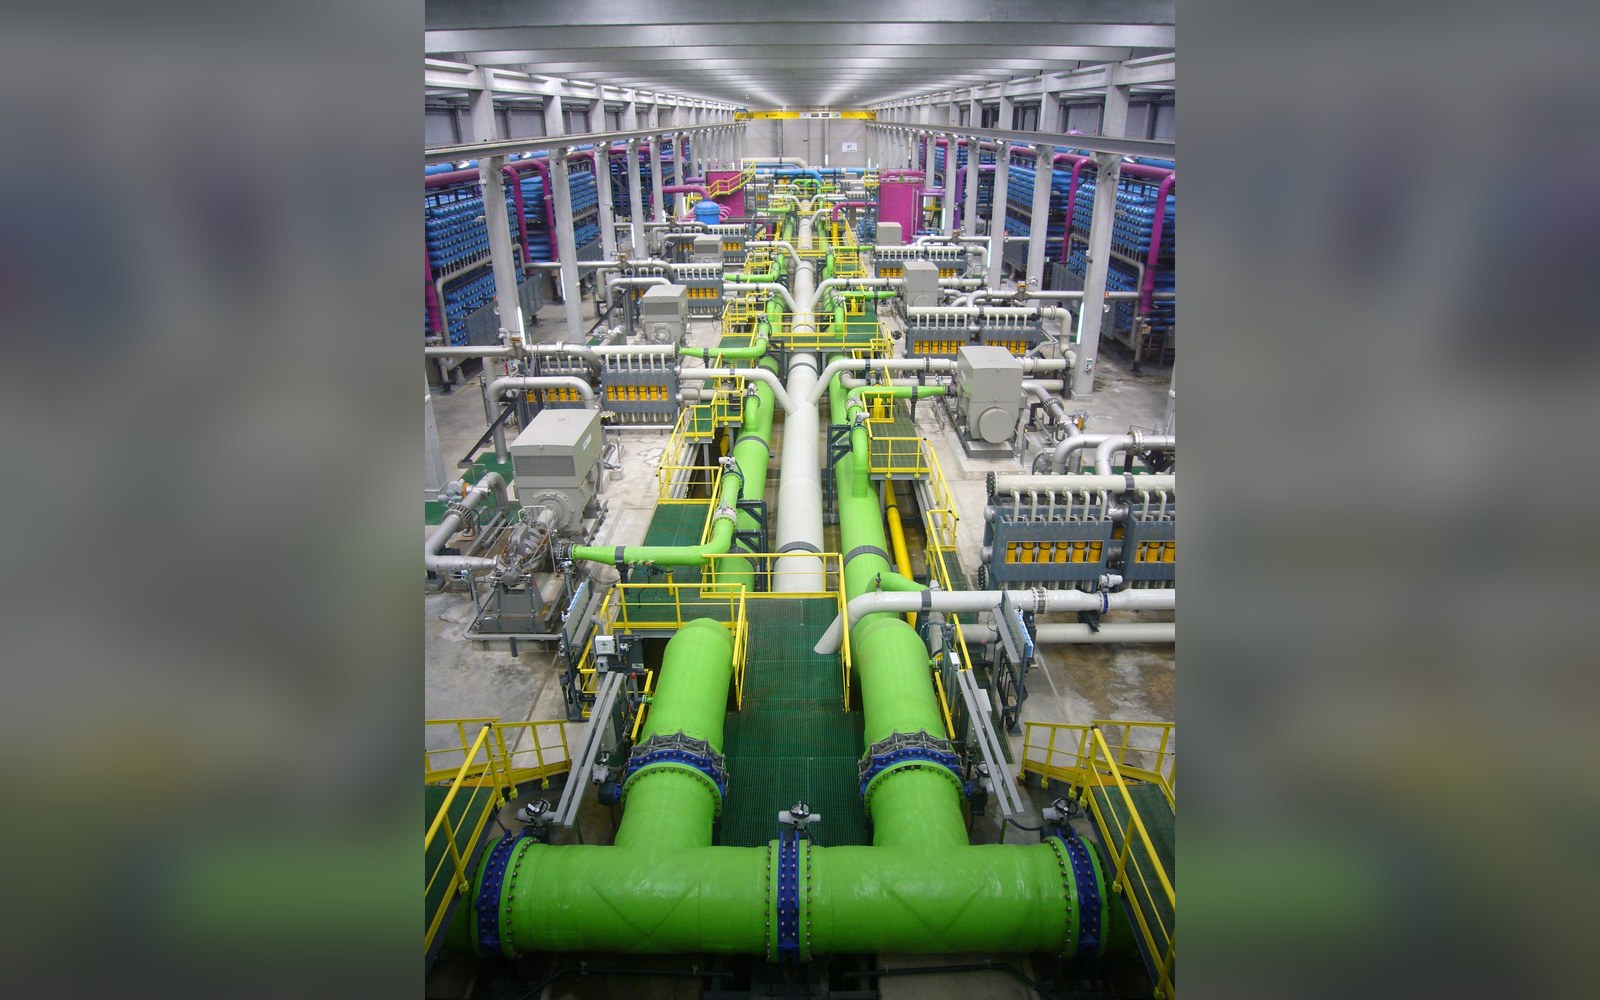
Flat islands import theirs — Limestone islands with no relief get little orographic rain and run on desalination, which sets the price of everything else.
Reverse osmosis desalination plant · Wikimedia Commons
The Structural Vulnerability
What the raw meteorology cannot capture is the relationship between storm intensity and pre-existing conditions. The Greater Antilles — Cuba, Hispaniola, Jamaica, Puerto Rico — carry the largest populations and, in several cases, the most degraded infrastructure. When a major hurricane crosses Haiti, the combination of high population density, limited construction standards, deforested hillsides prone to landslides and shallow earthquake-damaged housing stock turns a meteorological event into a demographic catastrophe. The same Category 4 crossing the open Atlantic is a data point; crossing a hillside shantytown built on a flood channel it becomes a death toll.
For smaller eastern islands, the structural vulnerability is different in character but equally legible. An island economy running on tourism and banana exports — as much of the Lesser Antilles ran for most of the twentieth century — can have its entire revenue base disrupted in a single landfall. Banana plantations are levelled by winds that snap trees before they break concrete. Hotel stock that took a decade to finance and build can lose its roof in an afternoon. The recovery timeline for physical infrastructure routinely runs three to five years; for agricultural perennial crops it runs longer. Barbados, sitting just east of the arc and relatively low in profile, experiences this cycle less severely than the volcanic islands to its north, but no island in the chain carries no exposure.
The institutional response to this geography has produced mechanisms worth noting. CARICOM's Caribbean Disaster Emergency Management Agency — CDEMA — functions as the regional coordination body when multiple islands are struck simultaneously or in sequence. After Maria, the question of how small states self-finance recovery without sovereign debt becoming unserviceable drove renewed attention to the Caribbean Catastrophe Risk Insurance Facility, the CCRIF, which provides parametric insurance — payouts triggered by wind speed and surge thresholds, not by assessed damage — to member governments. The payouts are fast precisely because they bypass the slow process of individual loss adjustment. They are also calibrated to provide liquidity in the immediate aftermath, not full reconstruction funding.
The season runs June to November. The peak sits in September. The record of named storms, major landfalls and economic losses is a compounding ledger that the region has kept, with increasing precision, since systematic observation began. What the ledger shows is not randomness but a documented climatology operating on a geography that concentrates exposure — small land areas, long coastlines, economies with limited fiscal buffers — against which the numbered categories of any given storm are only the opening line of a longer accounting.